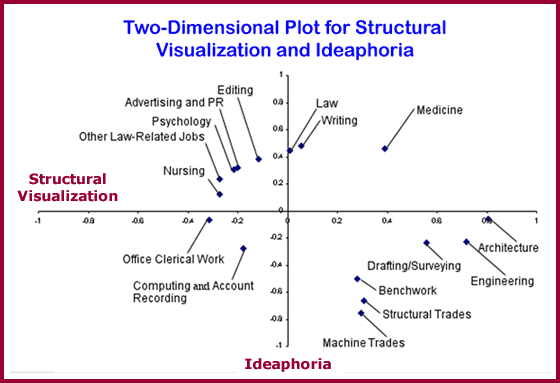
Two-dimensional occupational plots show simultaneously the mean performance of various occupational groups on two of our standard battery tests. The figure above shows how a number of groups scored on both Structural Visualization and Ideaphoria. As can be seen:
- Occupations such as Architecture and Engineering scored high on Structural Visualization and not on Ideaphoria;
- Occupations such as Law and Writing scored high on Ideaphoria and not Structural Visualization;
- Occupations such as Office Clerical Work and Computing and Account Recording did not score high on either scale.
Evaluating our data by looking at more than one ability at a time allows us to offer more customized recommendations for clients in search of career guidance.


