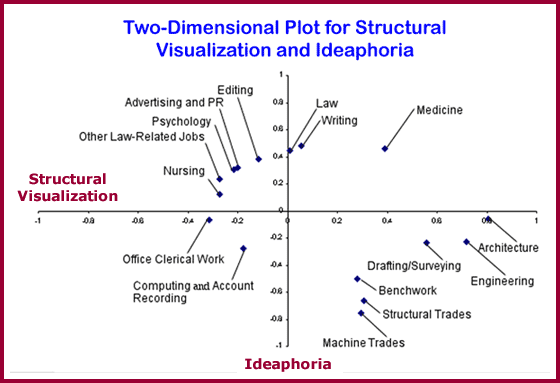
Two-dimensional occupational plots show simultaneously the mean performance of various occupational groups on two of our standard battery tests. The figure above shows how a number of groups scored on both Structural Visualization and Ideaphoria. As can be seen:
- occupations such as architecture and engineering scored high on Structural Visualization and not on Ideaphoria;
- occupations such as law and writing scored high on Ideaphoria and not Structural Visualization;
- and occupations such as office clerical work and computing and account recording did not score high on either scale.


